Drop in a CSV and get a profile of every column, the relationships between numbers, and quick charts. Nothing is uploaded anywhere.
Overview
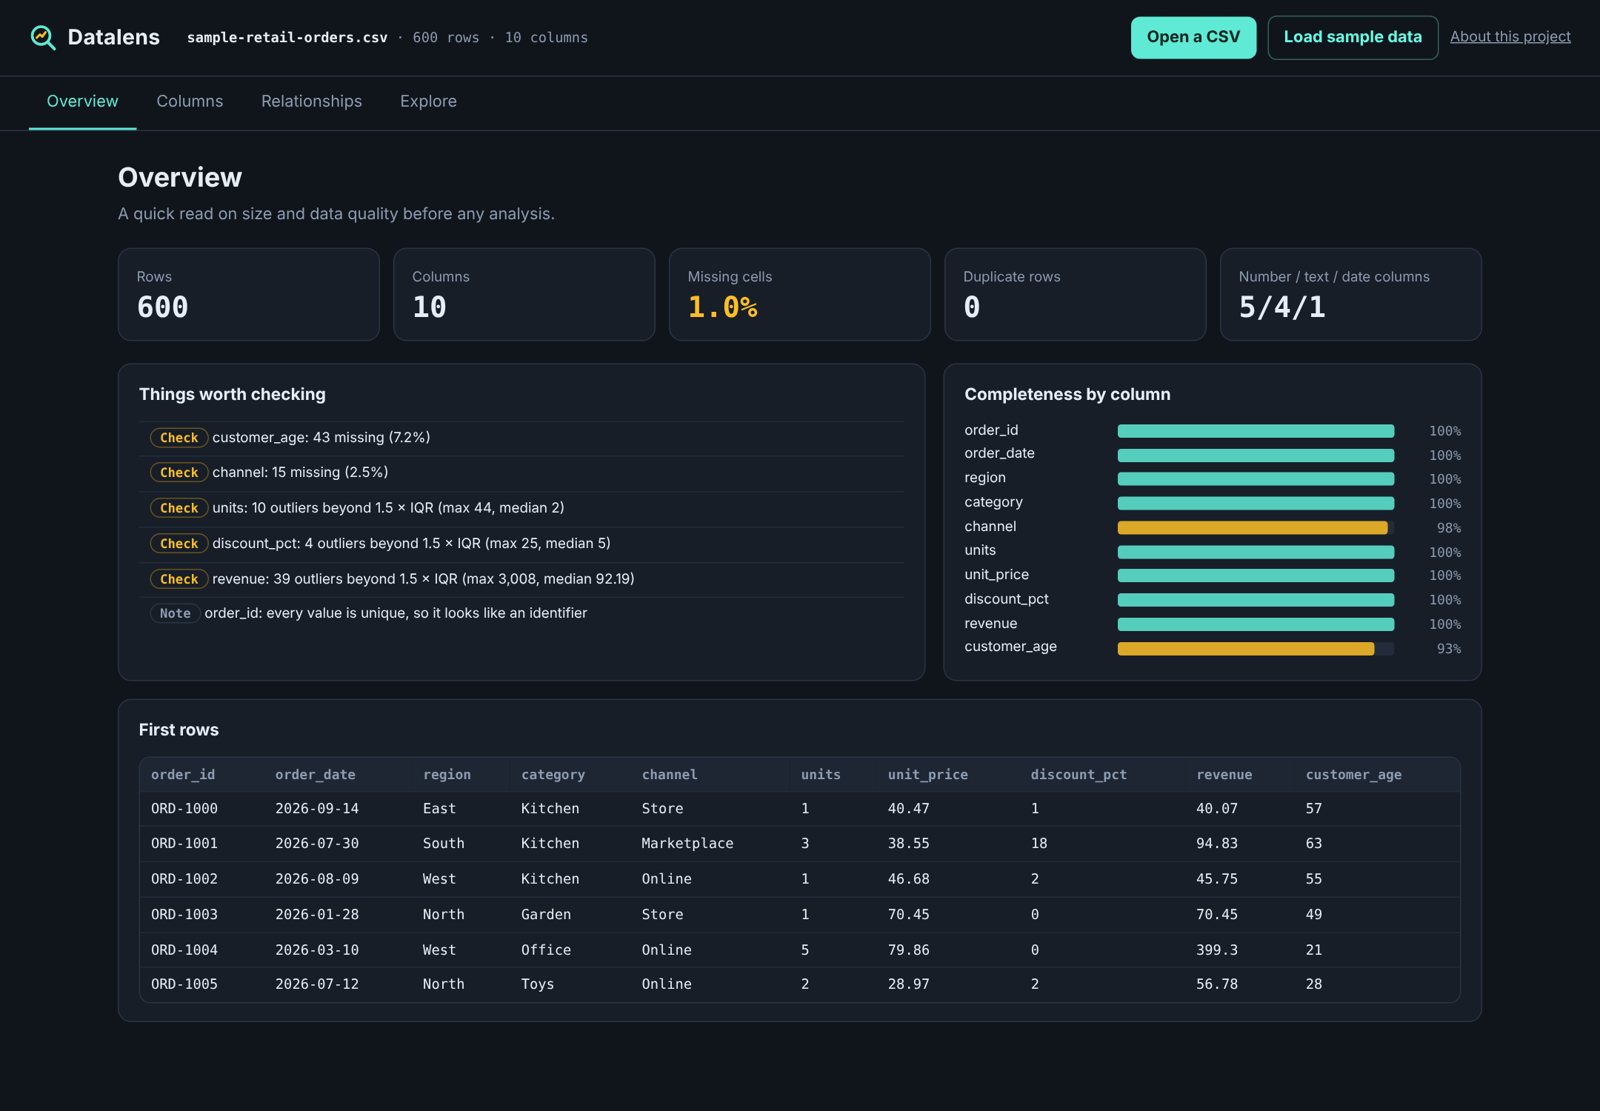
Datalens reads a CSV file on your device and reports what is in it: types, missing values, spread, outliers and duplicates, then lets you explore groups, trends and correlations. Runs entirely in the browser with sample data and no server. It is an original BURGTECH product demo, not software in use by any client. Your own files are processed locally and never leave the page.
The problem
Before analysing a dataset you need to know what is wrong with it. That first look is usually slow and manual.
The solution
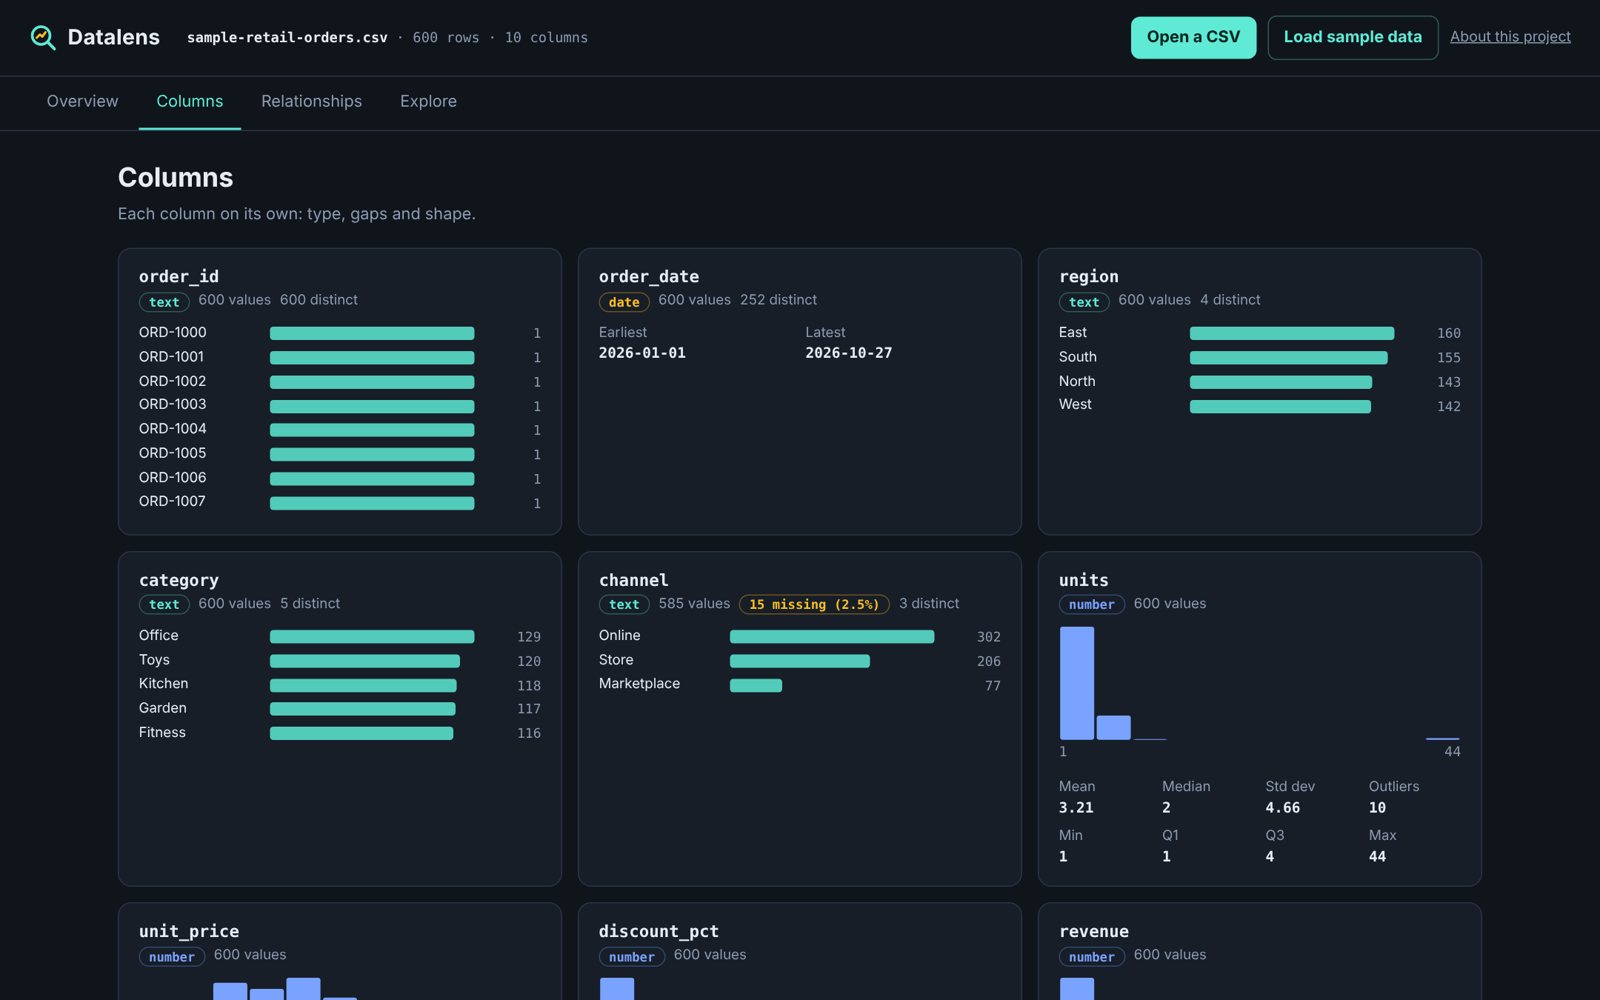
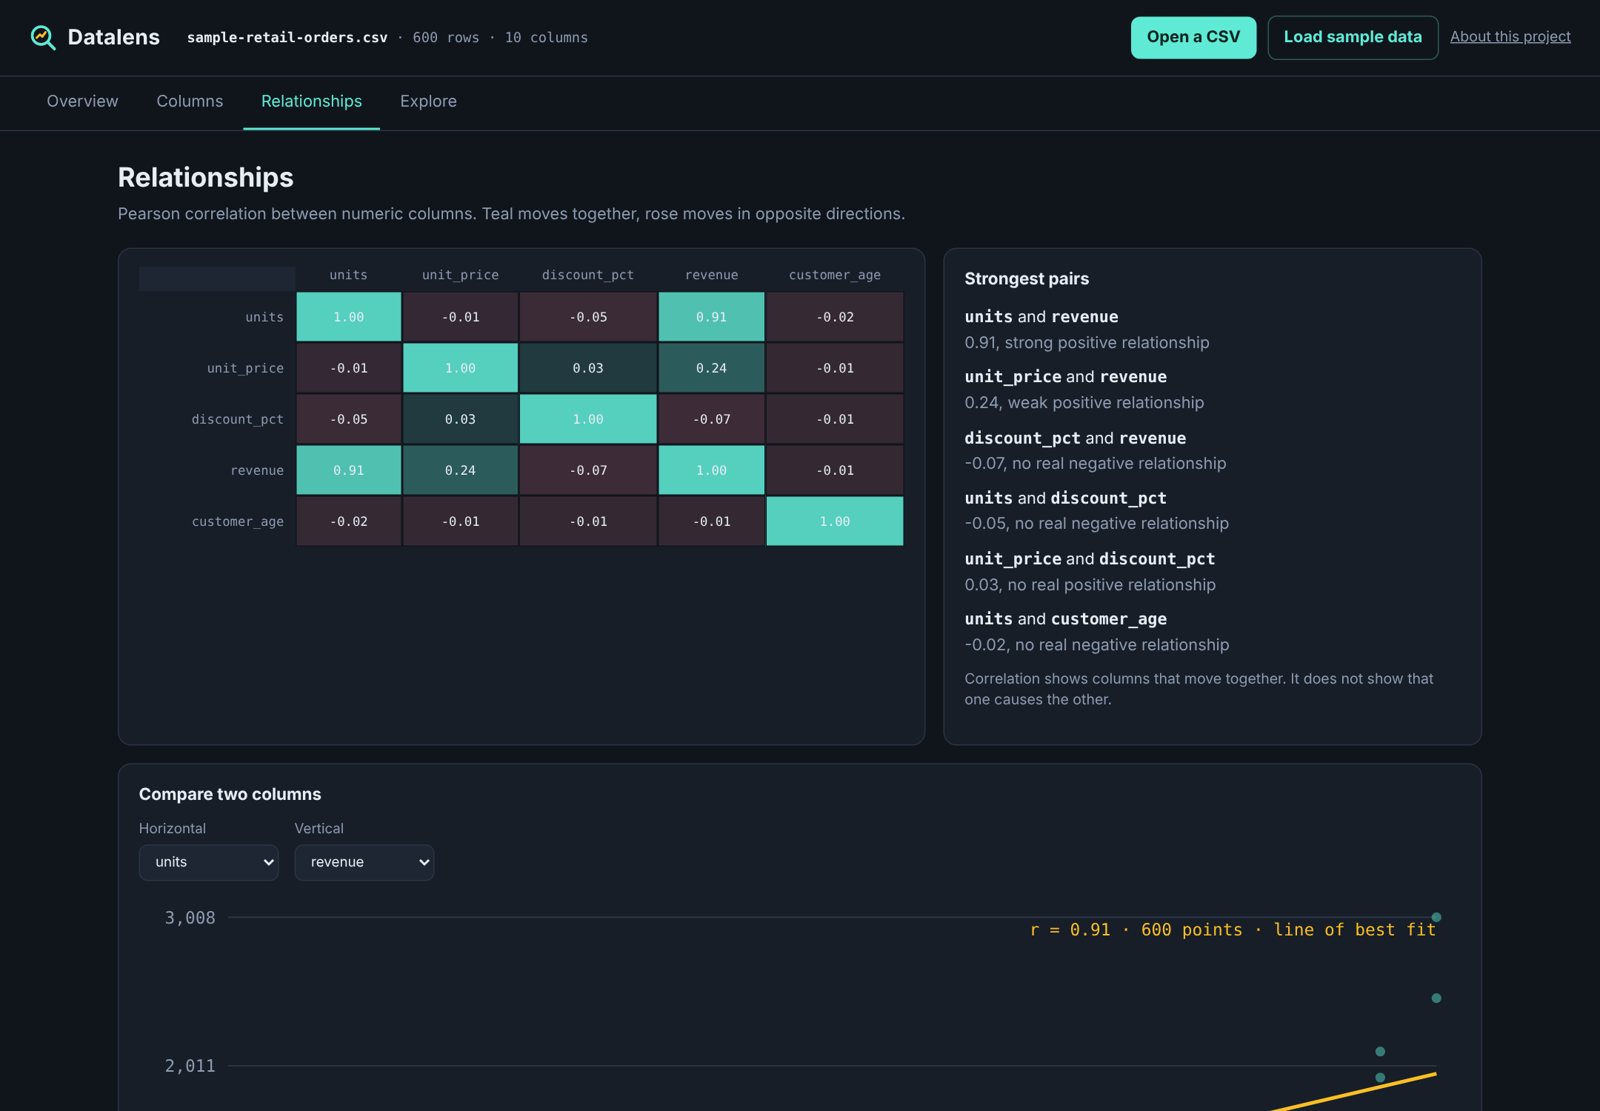
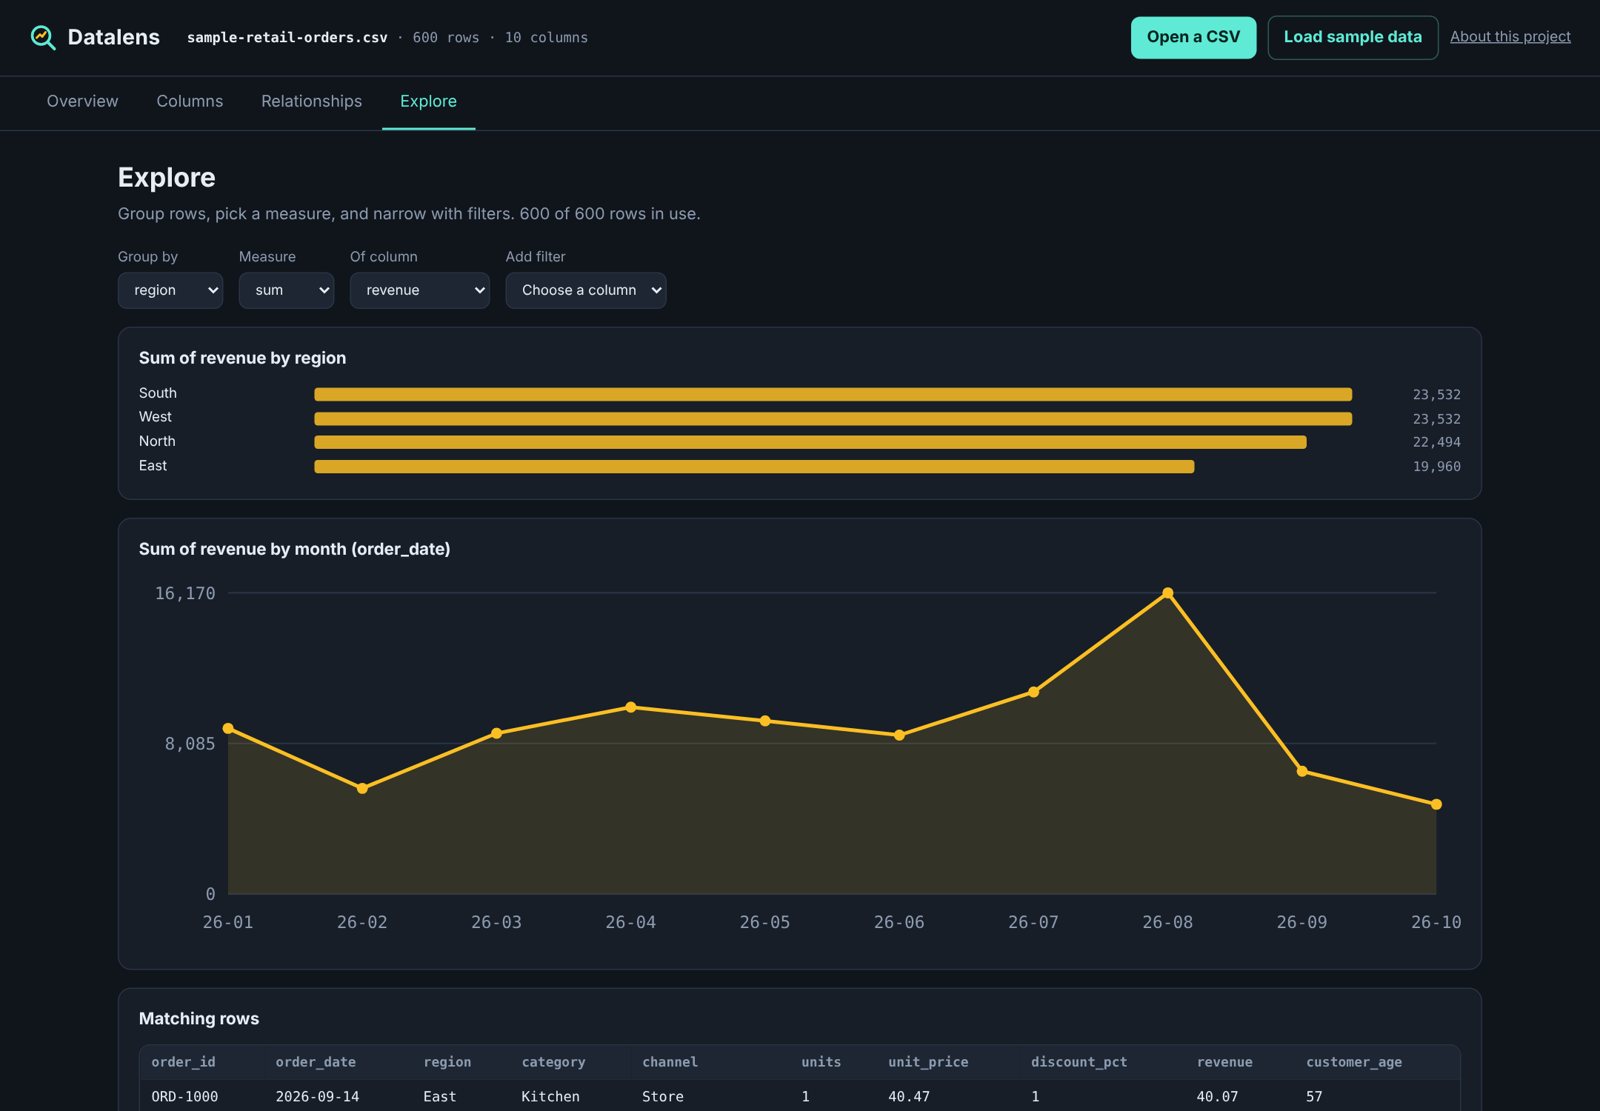
A local profiler that infers column types and summarises completeness, distribution and outliers, with correlation, scatter, monthly trend and group-by views.
Key functionality
Column type inference and completeness bars
Mean, median, spread, quartiles and outlier counts
Correlation matrix and scatter plot with best-fit line
Group by and monthly trend views
Filters on any column
Built-in sample dataset
Architecture
Static single-page app. Parsing and statistics are plain ES modules with Node tests. Charts are SVG.
Contribution
Designed, built and tested by Burgess Awalayah Glay.